
ECG is a valuable tool in a clinician’s diagnostic toolset, however for some it’s just not easy to pick up. Most individuals skilled in ECG have achieved proficiency through practice and exposure, as interpreting ECG in the long term is a matter of pattern recognition. Today, I hope to bring things back to the basics. To lay the foundations, which will guide you in interpreting ECGs, and at the very least, reporting them in a manner that will be of use to more experienced clinician’s.
If you are unfamiliar with the conduction system of the heart, I recommend doing a quick refresh before continuing (Electrical Conduction of the Heart). In addition for common pathologies take a look at Cardiac Arrhythmias overview.
So What is an ECG?
Electrocardiography (ECG or EKG) is essentially a picture of the electrical activity of the heart over time captured via external electrodes.
Where to measure and what it measures
The most important part of interpreting an ECG is to ensure that all electrodes are placed in the correct location before performing an ECG. Changes in electrode placement will ultimately affect the picture (i.e. ECG trace) that you will obtain. Since interpretation includes comparison against standardised traces, it is important that the electrodes are placed correctly. The image below provides an overview of where the electrodes are place upon the body, and the corresponding normal ECG trace for the standard 12 Lead ECG.

What the Leads Measure
Do not get leads confused with wires. There are 10 wires in a 12 Lead ECG.
Each lead takes a snapshot of the electrical activity of the heart from a different perspective. For example, Lead I examines the lateral border of the heart. The twelve leads of a twelve-lead ECG are shown here, with the contiguous leads shown in the same colour.
Below is simple explanation of how leads work, however please note this is not the full mechanism and if interested I recommend further reading.

Some Important Points
Cardiac Axis
The cardiac axis refers to the mean direction of the wave of ventricular depolarisation in the vertical plane, measured from a zero reference point. The zero reference point looks at the heart from the same viewpoint as lead I.

The normal range for the cardiac axis is between -30 and 90 degrees as highlighted by the green area in the diagram above. Einthoven's triangle is one method used to calculate cardiac axis.

When the upward and downward deflection of the QRS complex is equal in a Lead, the cardiac axis will be perpendicular to what that lead measures. For example, if the deflections were equal in Lead III it would suggest that the cardiac axis is at 30 degrees.
How the ECG trace fits into the Cardiac Cycle

What an ECG trace looks like.

P wave: atrial depolarization
QRS complex: (<120ms)
PR interval: (120-200ms) time between beginning of P wave and beginning of QRS complex
ST segment: time between QRS complex and start of T wave (plateau phase of cardiac muscle)
QT interval: ~400ms - time between beginning of QRS complex and end of T wave
Normal: PT constant, but TP interval changes when HR changes
Reporting an ECG

One square = 40ms, five squares (or 1 big square) = 200ms
1. Rhythm & Rate
- Sinus rhythm (e.g. fibrillation?) - HR (e.g. tachycardia?)
Can be calculated either by;
2. Conduction intervals
PR interval (should be 120-200ms, 3-5 small squares)
QRS duration (should be ~120ms, 3 small squares)
3. Cardiac axis
Depends on anatomical build, relative mass of left & right ventricles and conduction pattern through Purkinje fibers.
Often ECG traces will include the Cardiac axis at the top of the trace. However, if it does not list the axis, there is a simple method of determining significant cardiac deviation.
Left Axis Deviation: If the QRS complex in Lead I is strongly positive and is negative in aVF.
Right Axis Deviation: If the QRS complex in Lead III is positive and is negative in Lead I.
4. Description of QRS complex
5. Description of ST segment and T wave
To assist in remembering how to report an ECG try the following mnemonic.
Rolls Royces In Seattle Are High Priced InvestmentS In Deed
Each of the 9 headings relate to domains to be evaluated about each 12-lead tracing.
Or if you're from Australia try this one RACQ Professional Service Team.
Finally to conclude with a presentation of what some commonly observed cardiac abnormalities look like on an ECG Trace. Note however, that it is more important to develop correct ECG reporting skills first before proceeding to more complex pattern recognition.

That is it for this week’s lesson. In the meantime explore some of the resources listed below to further expand your knowledge.
Extra Resources
If you are unfamiliar with the conduction system of the heart, I recommend doing a quick refresh before continuing (Electrical Conduction of the Heart). In addition for common pathologies take a look at Cardiac Arrhythmias overview.
So What is an ECG?
Electrocardiography (ECG or EKG) is essentially a picture of the electrical activity of the heart over time captured via external electrodes.
Where to measure and what it measures
The most important part of interpreting an ECG is to ensure that all electrodes are placed in the correct location before performing an ECG. Changes in electrode placement will ultimately affect the picture (i.e. ECG trace) that you will obtain. Since interpretation includes comparison against standardised traces, it is important that the electrodes are placed correctly. The image below provides an overview of where the electrodes are place upon the body, and the corresponding normal ECG trace for the standard 12 Lead ECG.

Adapted from image by Madhero88
If you are unsure about electrode placement checkout the following video for a demonstration.
What the Leads Measure
Do not get leads confused with wires. There are 10 wires in a 12 Lead ECG.
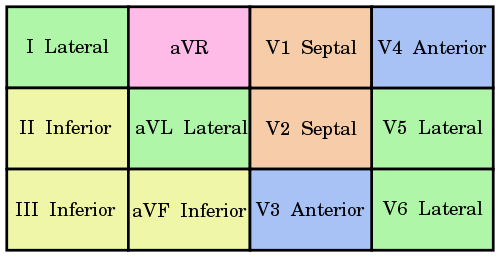
Each lead takes a snapshot of the electrical activity of the heart from a different perspective. For example, Lead I examines the lateral border of the heart. The twelve leads of a twelve-lead ECG are shown here, with the contiguous leads shown in the same colour.
Pink – Lead aVR offers no specific view of the left ventricle.
Orange – Septal Leads (V1, V2)
Yellow – Inferior Leads (II, III, aVF)
Green – Lateral Leads (I, aVL, V5, V6)
Blue – Anterior Leads (V3, V4)
Contiguous Leads by Cburnett
Below is simple explanation of how leads work, however please note this is not the full mechanism and if interested I recommend further reading.
- ◘ If the direction of depolarisation is toward a lead, the trace will move upward from baseline.
- ◘ If the direction of depolarisation is away from a lead, the trace will move downward from baseline.

Image by Aaron Sparshott (CC 3.0 license)
Some Important Points
- ◘ Septum depolarizes from Left to Right
- ◘ Left Ventricle has more influence than Right Ventricle on ECG (hence normal cardiac axis is typically more left)
- ◘ Depolarization from Endocardium to Epicardium
- ◘ Repolarization from Epicardium to Endocardium
Cardiac Axis
The cardiac axis refers to the mean direction of the wave of ventricular depolarisation in the vertical plane, measured from a zero reference point. The zero reference point looks at the heart from the same viewpoint as lead I.

The normal range for the cardiac axis is between -30 and 90 degrees as highlighted by the green area in the diagram above. Einthoven's triangle is one method used to calculate cardiac axis.

Original by Tor Ercleve. Adapted by Aaron Sparshott. Permission for use granted by Mike Cadogan.
When the upward and downward deflection of the QRS complex is equal in a Lead, the cardiac axis will be perpendicular to what that lead measures. For example, if the deflections were equal in Lead III it would suggest that the cardiac axis is at 30 degrees.
How the ECG trace fits into the Cardiac Cycle

What an ECG trace looks like.

P wave: atrial depolarization
QRS complex: (<120ms)
- ◘ Q wave: first downward (negative) deflection (not always present) ~ septal depolarization
- ◘ R wave: upward (positive) deflection
- ◘ S wave: downward (negative) deflection following an R wave
PR interval: (120-200ms) time between beginning of P wave and beginning of QRS complex
ST segment: time between QRS complex and start of T wave (plateau phase of cardiac muscle)
QT interval: ~400ms - time between beginning of QRS complex and end of T wave
Normal: PT constant, but TP interval changes when HR changes
Reporting an ECG

A Normal 12 Lead ECG Trace with a Rhythm Strip
One square = 40ms, five squares (or 1 big square) = 200ms
1. Rhythm & Rate
- Sinus rhythm (e.g. fibrillation?) - HR (e.g. tachycardia?)
Can be calculated either by;
- ◘ 300 divided by the number of large squares between two R waves.
- ◘ Count the number of complexes in a 10 second rhythm strip and times by six.
- ◘ And the most simple method, reading the top of the ECG.
2. Conduction intervals
PR interval (should be 120-200ms, 3-5 small squares)
- ◘ think Heart Block if PR interval > 200ms.
QRS duration (should be ~120ms, 3 small squares)
- ◘ think Ventricular Rhythm Defect or Bundle Branch Block if QRS duration > 120ms .
3. Cardiac axis
Depends on anatomical build, relative mass of left & right ventricles and conduction pattern through Purkinje fibers.
Often ECG traces will include the Cardiac axis at the top of the trace. However, if it does not list the axis, there is a simple method of determining significant cardiac deviation.
Left Axis Deviation: If the QRS complex in Lead I is strongly positive and is negative in aVF.
Right Axis Deviation: If the QRS complex in Lead III is positive and is negative in Lead I.
4. Description of QRS complex
- ◘ Duration
- ◘ Shape (slurred upstroke?)
- ◘ Q wave (pathological = >40ms in duration, 2>mm in depth, and/or 25% of R wave size)
- ◘ Wolf-Parkinson-White: accessory conduction pathway (shorter PR interval, wide QRS with slurred upstroke)
5. Description of ST segment and T wave
- ◘ Elevation vs. Depression
- ◘ T wave (inverted normally in V1 and aVR)
- ◘ Ischaemic -> less ATP -> less NaK atpase -> higher K+ outside cell -> lower RMP ->; ST depression
To assist in remembering how to report an ECG try the following mnemonic.
Rolls Royces In Seattle Are High Priced InvestmentS In Deed
Each of the 9 headings relate to domains to be evaluated about each 12-lead tracing.
- Rolls relates to the assessment of ventricular RHYTHM and should be classified as regular or irregular.
- Royces refers to RATE of ventricular response and should be classified and normal, bradycardia or tachycardia.
- In refers to INTERVALS among and between PQRST waves and should be compared for consistency among complexes. Remember, a sinus rhythm must have consistent PR intervals.
- Seattle refers to SHAPE of the wave-forms and the P wave, the QRS complex, and T-wave should be evaluated. To make the diagnosis of Sinus Rhythm, consistent P waves should be seen consistently from beat to beat to beat, appear identical and be associated with a consistent PR interval.
- Are refers to the vectorial AXIS of the QRS-complex and the T-wave. Discordance in vector axises indicate pathology or strain upon the heart muscle mass and demands careful evaluation, even in the absence of blatant pathology discussed below.
- Priced refers to PROGRESSION of the R-wave as evaluated in the anterior chest leads. Failure of the R-waves to appear progressively larger in size, from lead V1 to V6, indicates loss of heart muscle consistent with infarction or other gravely serious pathology.
- InvestimentS refers to the feature S that are pathognomonic of ISCHEMIA and INFARCTION. The features should be evaluated from an anatomically geographic perspective from contiguous leads. The regions include left posterior heart, inferior heart, septal aspect, anterior wall and posterior aspect.
- In Deed refers to INTERPRETATION DONE last and represents consideration of all the findings found or not found in the categories cited above and carefully considered in clincal context. The diagnosis is based upon the preponderance of evidence.
Or if you're from Australia try this one RACQ Professional Service Team.
Finally to conclude with a presentation of what some commonly observed cardiac abnormalities look like on an ECG Trace. Note however, that it is more important to develop correct ECG reporting skills first before proceeding to more complex pattern recognition.

That is it for this week’s lesson. In the meantime explore some of the resources listed below to further expand your knowledge.
Extra Resources
- ECG Library
◘ http://www.ecglibrary.com/ecghome.html - ECG Wave-Maven (Test your Skills)
◘ http://ecg.bidmc.harvard.edu/maven/mavenmain.asp - The Whole ECG – a really basic ECG Primer
◘ http://www.anaesthetist.com/icu/organs/heart/ecg/Findex.htm - LifeintheFastLane’s ECG Library
◘ http://lifeinthefastlane.com/resources/ecg-library/


This comment has been removed by a blog administrator.
ReplyDelete